
Overview
1 of 8The Real-Time Dashboard shows live Amazon Connect metrics and agent status across all four regions, using a customizable grid of tiles. Supervisors and managers can build a personal or team wallboard without needing access to the Connect console or any BI tooling.
Custom Tiles
Mix and match 8 tile types — agent status, queue metrics, call stats, service level, and more.
Multi-Region
Switch between US, EU, Tokyo, and Singapore Connect instances from one dropdown.
Auto-Refresh
Data refreshes automatically every 5–60 seconds, or refresh manually at any time.
Saved Profiles
Admins save named dashboard layouts and assign them to teams via Cognito groups.
ConnectTools-Admin) can create, edit, and delete dashboard profiles. Other
users only see profiles assigned to their groups via
User Management → Groups → Dashboard Access Groups.
Key Concepts
2 of 8Tiles
A tile is a single widget on the dashboard grid — for example, a table of agent statuses or a live call volume chart. Each tile has its own type, size, and (for most types) its own set of selected queues, so different tiles can track different queues at the same time.
Dashboard Profiles
A dashboard profile is a named, saved layout — the full set of tiles, their queues, sizes, and thresholds. Profiles are created by admins and stored centrally, then assigned to Cognito groups so the right teams see the right dashboards. Your personal tile drag/resize adjustments are saved locally in your browser on top of the shared profile.
Regions
The Region dropdown switches which Amazon Connect instance the dashboard reads from: US East (Virginia), EU Central (Frankfurt), Asia Pacific (Tokyo), or Asia Pacific (Singapore). Queue lists and live metrics reload automatically when you change region.
Auto-Refresh
Choose how often the dashboard polls for new data — 5, 15, 30, or 60 seconds, or Manual to only refresh when you click the 🔄 button. Shorter intervals give more up-to-date data but generate more API calls, so pick the shortest interval that's actually useful for your use case (15–30 seconds is a good default for a wallboard).
Using the Dashboard
3 of 8Opening a Dashboard
- 1 Log in to the GN Connect Tools Portal.
- 2 Click the Real-Time Dashboard card on the homepage.
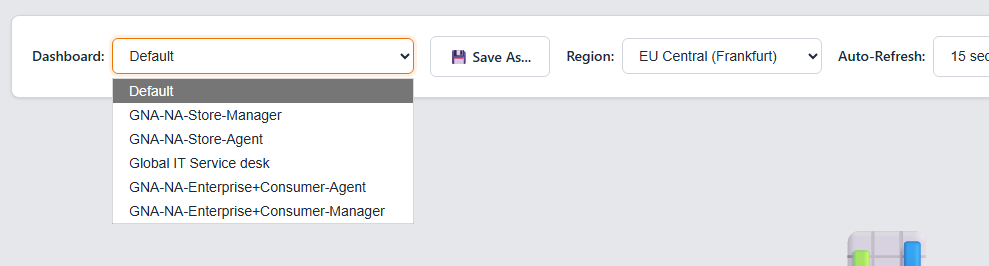
- 3 Use the Dashboard dropdown to pick a saved profile assigned to you. If you don't have one yet, you'll see a message asking you to contact your administrator.
- 4 Use the Region dropdown to switch Connect instances if your team spans more than one region.
- 5 Set your preferred Auto-Refresh interval, or click 🔄 to refresh on demand.
Tile Types
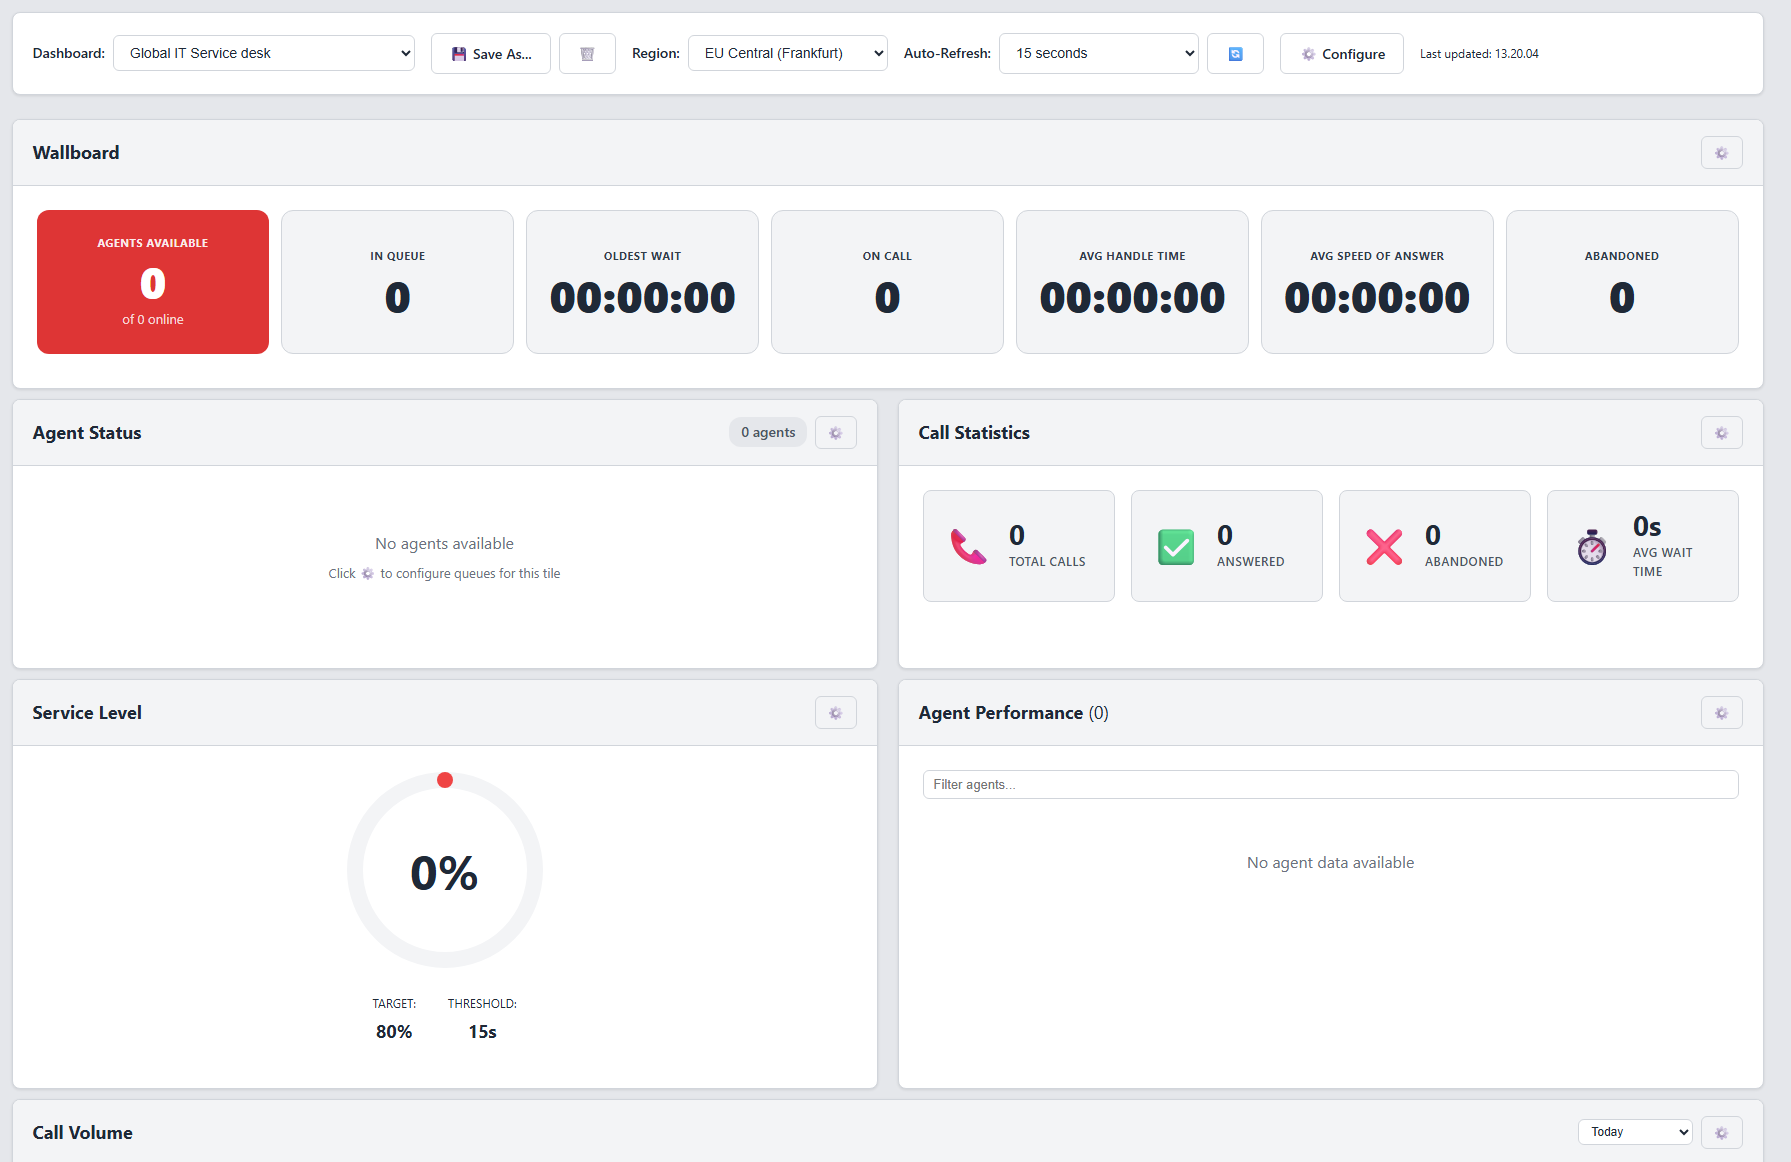
4 of 8The dashboard supports 8 tile types, each showing a different slice of Connect data:
| Tile Type | Shows |
|---|---|
| Agent Status | Live list of agents and their current status (Available, On Call, ACW, etc.) for the tile's selected queues. |
| Queue Metrics | Real-time in-queue count, available agents, and longest wait time, with configurable warning/critical color thresholds. |
| Call Statistics | Today's call volume totals (handled, abandoned, etc.), calculated in the dashboard's configured timezone. |
| Service Level | A gauge showing the % of calls answered within a threshold (in seconds), compared to a target %. |
| Call Volume Chart | A live chart (via Chart.js) of call volume trends over time. |
| Agent Performance | Per-agent performance metrics such as handled calls and talk time for the selected queues. |
| Wallboard | A compact summary tile combining several key metrics with toggleable rows and thresholds — ideal for TV displays. |
| Queue Stat | A single big-number stat for one metric (e.g. calls in queue), with configurable color thresholds. |
Configuring Tiles
5 of 8Admins can add, edit, and remove tiles for a dashboard profile.
Adding a Tile
- 1 Click ⚙️ Configure in the controls bar (admin-only).
- 2 Pick a tile type from the dropdown and click + Add Tile.
- 3 Click the new tile's own ⚙️ button to assign which queues it should track, and set any thresholds or targets specific to that tile type.
- 4 Close the Configuration modal — the tile appears immediately on the grid.
Tile-Specific Settings
- Service Level — threshold in seconds and target % (controls gauge color).
- Queue Metrics — warning/critical thresholds for in-queue count, available agents, and longest wait.
- Wallboard — toggle which metric rows are shown and their thresholds.
- Queue Stat — choose which single metric to display and its color thresholds.
Timezone
The Settings section of the Configuration modal lets you set the timezone used for historical metrics (Call Statistics and Service Level are calculated for "today" in this timezone).
Layout & Resizing
6 of 8- Reorder: click and drag a tile onto another to swap their positions on the grid.
- Resize: drag the small handle in a tile's bottom-right corner to change its width and height.
- Reset: use Reset Tile Positions in the Configuration modal to restore the profile's original layout.
Saving & Sharing Profiles
7 of 8Only members of ConnectTools-Admin can save, overwrite, or delete dashboard profiles.
- 1 Build the tile layout you want (add tiles, assign queues, set thresholds).
- 2 Click 💾 Save As..., give the profile a name and optional description, then save. Saving over an existing name overwrites that profile.
- 3 Go to User Management → Groups → Dashboard Access Groups and assign the new profile to the Cognito group(s) that should see it.
- 4 Members of those groups will now see the profile in their Dashboard dropdown the next time they load the page.
Tips & Troubleshooting
8 of 8| Issue | Likely Cause / Fix |
|---|---|
| "No Dashboards Assigned" message | Your account isn't in a Cognito group linked to a dashboard profile. Ask an admin to assign one via Dashboard Access Groups. |
| Tile shows no data / blank | Check the tile has queues assigned (⚙️ on the tile) and that you're on the correct Region. |
| 💾 Save As / 🗑️ delete buttons missing | These are only visible to ConnectTools-Admin members. Ask an admin to make the change, or save changes on your behalf. |
| My layout changes disappeared | Tile drag/resize is stored in browser localStorage — it won't carry over to a different browser, device, or private/incognito session. |
| Data looks stale | Check the Auto-Refresh interval isn't set to Manual, or click 🔄 to refresh immediately. |